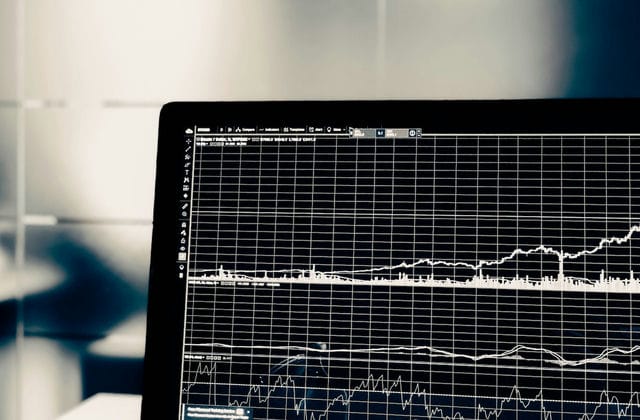
Money flow.
Inflow and outflow data.
Combine these data to predict how much the stock will rise or fall. If there is a large discrepancy between the actual share price and the prediction, it often hides a master conspiracy.
The data, that is, the volume, should be clearer than the k-line chart.
How to judge the main force movement from the hanging single.
Retail investors how to grasp the individual stock price run in buy one, buy two, buy three, buy four and sell one, sell two, sell three, sell four. Judging the movement of the main force.
1, When a stock in a day in the normal smooth operation, the stock price suddenly by the plate appeared in the thousands of large throw single smashed to a stop or stop near the board, and then was quickly pulled up. Or the share price was suddenly thousands of hands in the plate of the big buy orders pulled up and then quickly back to the position, these circumstances indicate that there is a main force in which to test the plate, the main force down to smash the plate, is to test the solidity of the foundation, and then decide whether to pull up. If the stock in a period of time always close the lower shadow line, the main force upward pull up the possibility of large; conversely, the stock if a period of time always close the upper shadow line, the main force out of the possibility of large.

2, When a stock for a long time in the downturn in the operation, a day stock price movement, and in the selling plate hanging huge throw single (each often hundreds, thousands of hands), but buy single relatively small, at this time, if there are funds into the field will be hanging in the sell a, sell two, sell three, sell four files of pressure single eat, can be regarded as the main force to build a position action. Because at this time the pressure single is not necessarily someone in the short, may be the main own chips, the main force in the volume, in attracting the attention of investors. At this point, if the continued presence of sell orders hanging out will be eaten, that will reflect the strength of the main force. But investors should pay attention, if you want to intervene, do not follow the trend of buying and selling plate, to be a big throw single disappeared, the share price in the plate retracement then intervention, to avoid the day chase high set. The main force sometimes sell single hanging out a large single, but also to scare away those who hold shares. In any case, the above-mentioned situation at low levels, intervention in general risk is not big, the main force upward pulling intention is obvious, short term although there is a shallow set may, but eventually can be some gains.On the contrary, if the shares are speculated after the disc commonly huge sell orders, sell a, two, three, four files always hundreds, thousands of hands pressure single, and not buy, at this time will have to pay attention to the risk, generally at this time out, can effectively hedge the risk.
3, A stock after a continuous decline, there is a regular protective action, in its buy a, two, three, four files common large buy orders hanging out, which is the absolute protective action. But this does not mean that the stock after the market stopped falling. Because in the market, the share price protection is not protected, "The best defense is offense", the main force to protect the plate, prove its lack of strength, or can push up the share price. At this point, the share price often has room to fall. But investors can pay attention to the stock, if the share price is at a low level, once the market turns strong, this stock will often also suddenly burst out, an amazing.
The most fundamental reason why retail investors lose money is the uncertainty of access to information
Although there are hundreds of indicators for technical analysis, at the end of the day, the most basic ones are price and volume, and other indicators are just variations or extensions of these two indicators.
The basic principle of the volume/price relationship is that "Volume is the cause, price is the effect; volume comes first, price comes second", which means that volume is the intrinsic driver of stock price movement. This has led to the derivation of various rules of volume/price relationships, which are used to specify specific investments. In practice, people will find that according to the volume of the relationship to buy and sell stocks, there are often mistakes, especially in the judgment of the main force according to the volume of shipments and wash, the error rate is higher, either the wrong wash as a shipment, prematurely sold, or mistakenly shipped as a wash, the out of not, the results of the loss of good opportunities for shipping.
So, in the actual investment how to change according to the volume, the correct judgment of the main force in and out of the direction. Or how, according to the volume of change, accurately determine the main force is in the shipments or washboard it?
Generally speaking, when the main force is not yet ready to lift the price of the stock, the performance of the stock price is often very dull, the volume of change is also very small. At this point in time, the study of volume has no practical significance, but also bad to determine the intention of the main force. However, once the main force to pull up the price of shares, its whereabouts will be exposed. We call this kind of stock a strong stock, at this time research volume changes, it has very important practical significance. At this point, if you can accurately capture the signs of the main force wash, and decisive intervention, often in a relatively short period of time to obtain the desired benefits. Practice has shown that, according to the characteristics of volume changes, you can make a more accurate judgment on whether the main force of the strong stock is in the washout.
1, Due to the active involvement of the main force, the original dull stock in the volume of the obvious enlargement to promote become active, there is a price rise in the amount of increase in the trend. Then, the main force in order to the future of the large pull up to level the obstacles, had to be short term profit taking to force wash away, this washing behavior, in the k-line chart often expressed as a yin and yang oscillation. At the same time, because the main purpose is to general investors out, therefore, the share price of the k-line pattern often into an obvious "Head form".

2, In the main washing stage, the k-line combination is often large yin constantly, and the number of times to close the yin, and each time the yin is accompanied by a huge volume, as if the main force is a big shipment. In fact, a closer look will reveal that when the above huge volume of large yin, the stock price rarely falls below the 10-day moving average, the short-term moving average of the stock price constitutes a strong support, the signs of the main force low backfill at a glance.
3, In the main force wash, as the main indicator of volume change OBV, average volume line, will also appear some obvious features, mainly: When the above large negative huge volume, the stock price of 5 days, 10 days average volume line always keep running up, indicating that the main force has been increasing positions, stock trading active, the market bullish. In addition, the quantitative indicator of volume, OBV, always stays up during the period of high stock price shock, and even if it momentarily falls back, it will quickly pull up and be able to make a new high in the near future. This indicates that from a volume perspective alone, the share price is primed to rise.


